
Theme 3: How can transit get you there?
Our third public input theme for NEXTransit was all about focusing on the transit connections you think are most important. We’d heard from you previously about where you experience transit gaps and challenges—the proposed transit connection areas have been developed based on your feedback and our analysis of a wide variety of data sets. We have lots of overview maps and info below, but if you crave more, be sure to check out this interactive map to see what the data says about your community! This all feeds into the proposed projects, policies, and programs that form the heart of the NEXTransit plan. Check those out here!
Can’t wait to play with the map? No problem—give it a try!
What’s NEXT? Check out some areas where transit connections could be further enhanced:
This map is the product of our last round of public input and data crunching. Make sure you read the sections below to see how we got here!
After taking public input and data analysis into consideration, it’s time to start putting pen to paper (so to speak). The next step is to distill what we’ve learned so far into major focus areas we’ve called “transit connection areas.”
The transit connection areas are numbered clockwise (not by priority!), with areas 1-7 being specific geographies, and 8-9 being conceptual connection types (neighborhood-to-neighborhood connections in/near the City and inner-ring suburban connections, respectively).
We’re collecting further input on these areas and the types of transit you’d like to see within them. We also want to know if we’ve missed any areas you think are important.
How we cooked up the map above: It starts with these basic ingredients…
Market and travel demand: the basics
Where people live
Allegheny County Population Density per Square Mile
Knowing where people live is step one, mainly because every trip has to start somewhere! Transit service works most efficiently when it serves lots of people in smaller areas—places that have higher density. It’s not the only factor, but it is important! As you’ll see later in this page, the places people choose to live are always changing, so how can transit keep up with these patterns?
Where people work
Allegheny County Job Employers by Number of Jobs
Work trips tend to be fairly regular—large numbers of people commute to jobs during peak travel periods (aka “rush hour”). Of course, lots of people are working at all hours of the day, so we also must look at different industry types to estimate travel demand during off-peak hours. Places where jobs are clustered are likelier to have more demand for transit service—since people are arriving to work from many places, understanding those patterns is critical.
Where people go
Origin/Destination Pairs with Over 1,000 Trips
Think of all the trips you normally take (before the pandemic). More than just your commute to work, it’s trips to the store, doctor, visiting family & friends, getting take-out for dinner, etc. Those trips add up! Research shows that most peoples’ trips are under five miles, so how can transit serve those trips as well as work trips? The map above shows the most highly traveled origin/destination pairs in our area—does your neighborhood have a line connecting to it?
The only constant
is change.
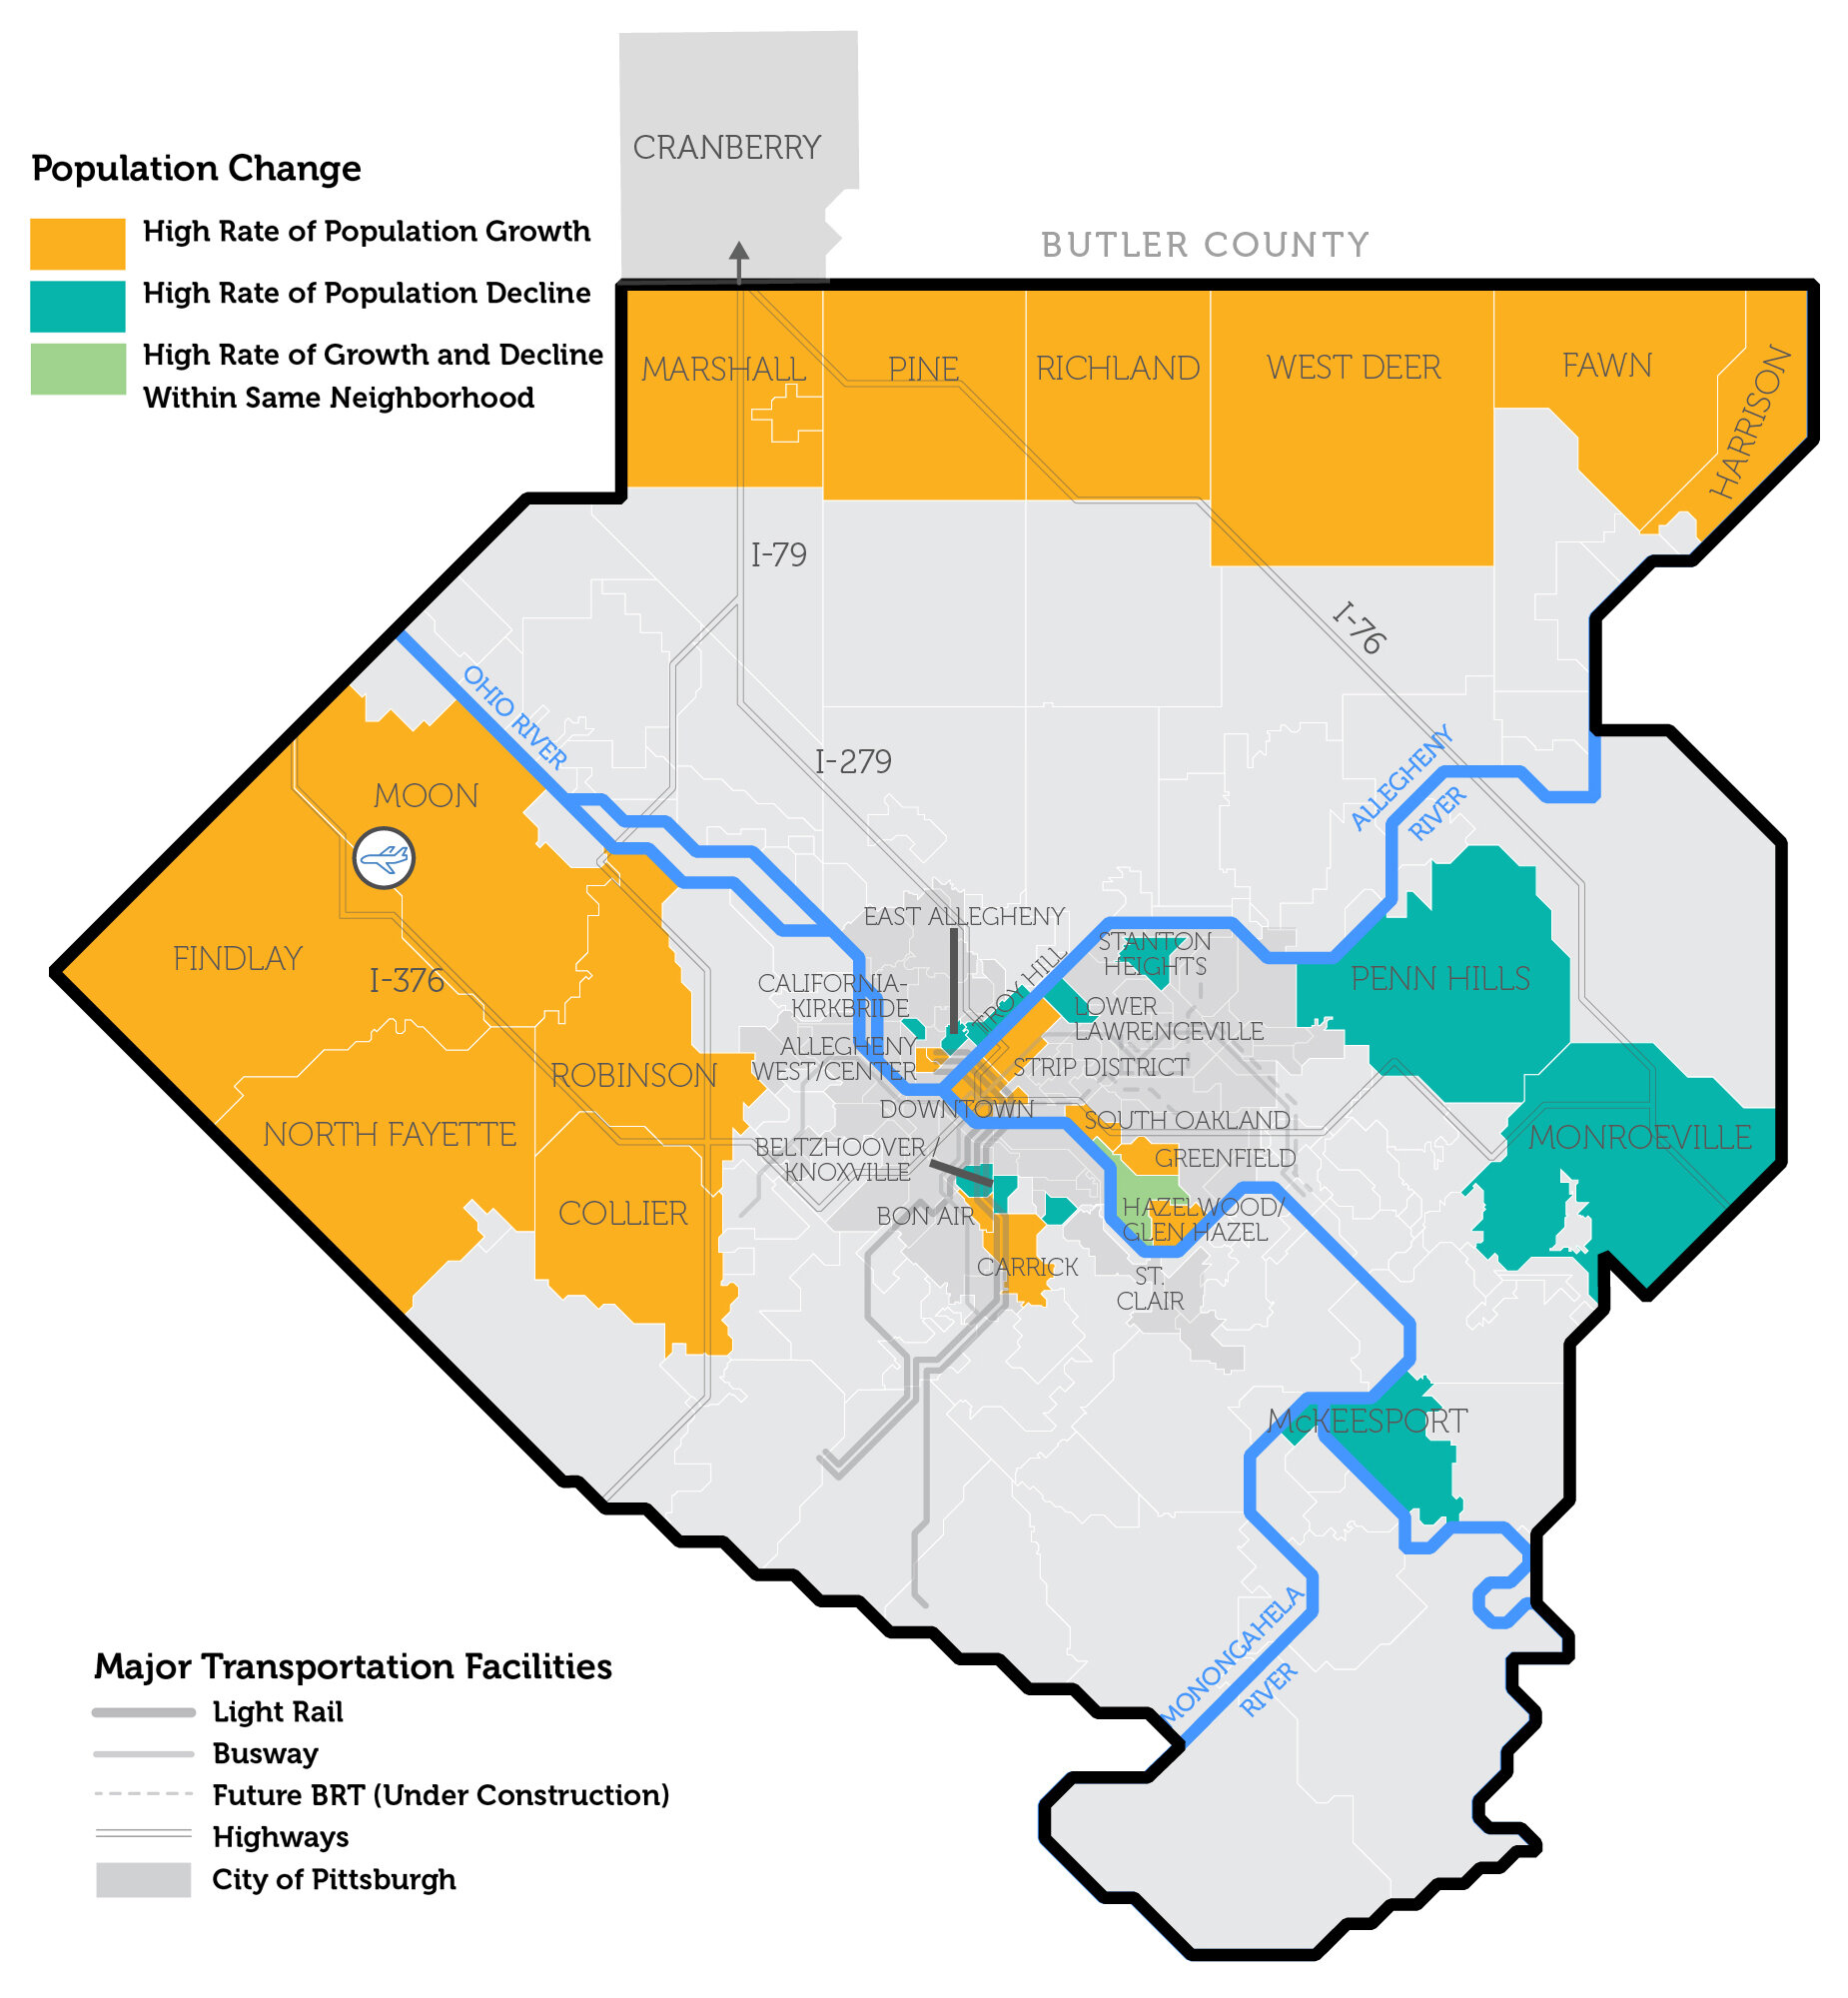
Regions, cities, and neighborhoods are always changing. Our employment centers grow and shrink, and commuting patterns evolve. Keeping track of those changes is important to planning for growth (and encouraging smarter growth) using transit. Take a deeper dive into not just the where of population change, but the why.
Our population is constantly changing, our jobs and employment centers grow and wane, and commuting patterns evolve. We looked at where major demographic changes have been occurring.
What are some major transit gaps?
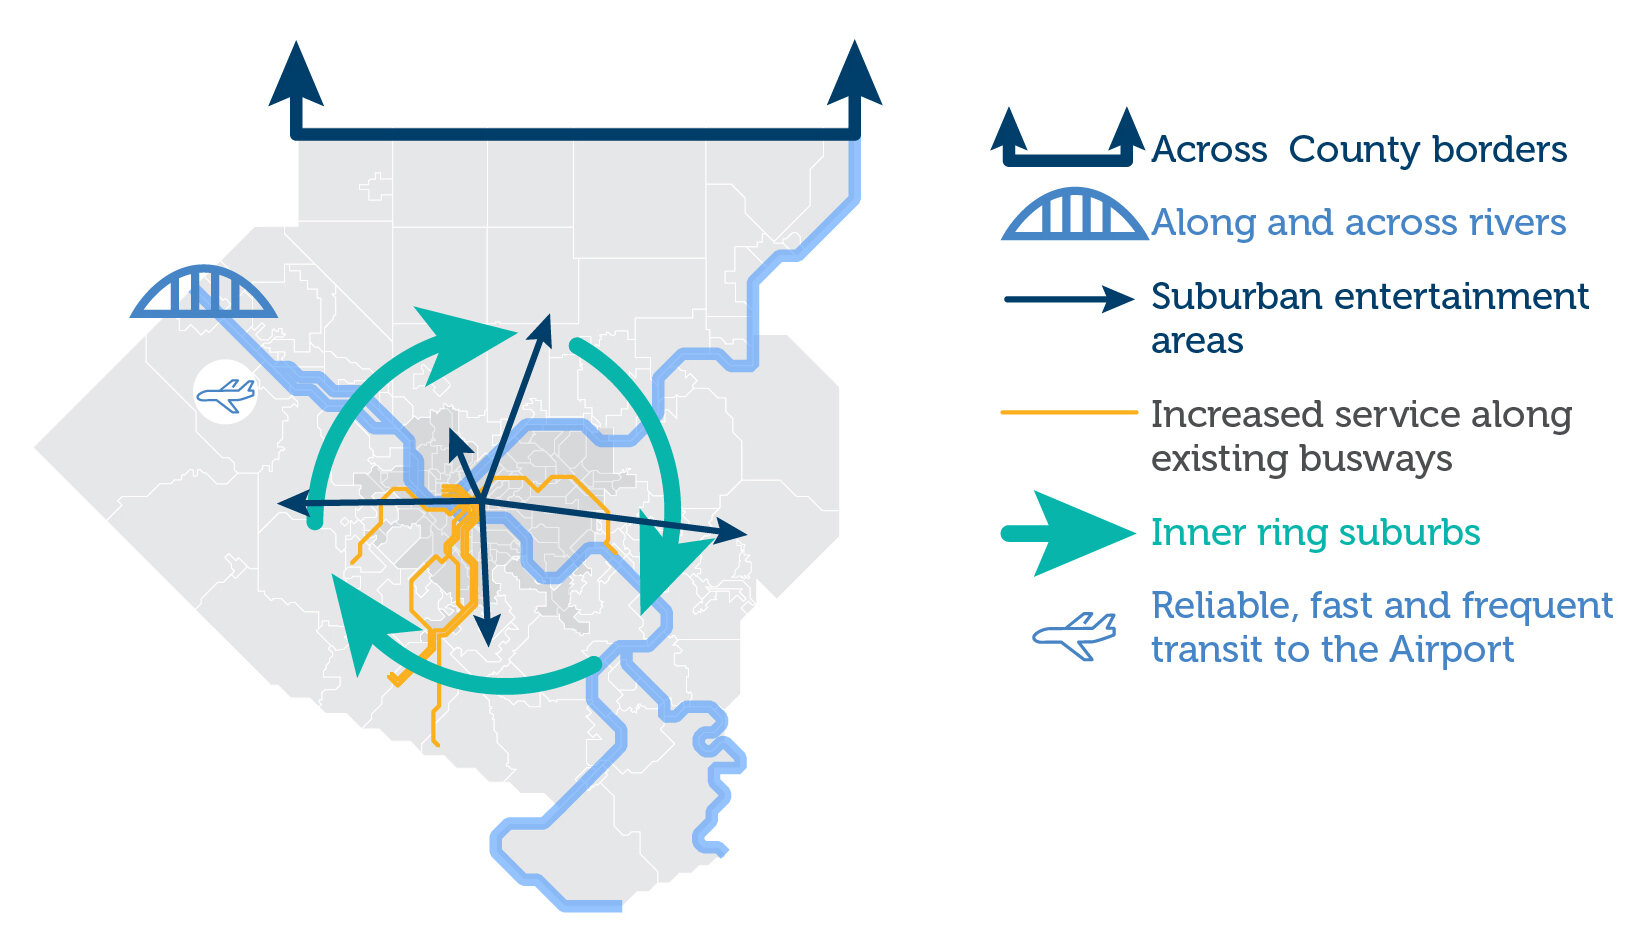
Transit gaps exist in a number of forms—some are places transit simply doesn’t go today, some are places where transit exists, but doesn’t serve peoples’ needs well, some are made up of places without sidewalks or where physical or topographical barriers exist.
Over the summer of 2020, the NEXTransit team heard from the public that better connections into the suburbs were needed along with more neighborhood-to-neighborhood connections (without having to go through Downtown). Faster transit to the airport was a frequent topic, along with increased service along the existing rapid transit network (light rail and busways).

How likely are people to use transit, anyway?
There are a few good ways to learn where transit would be most effective. In addition to the key standalone metrics shown above, planners can utilize weighted combinations of data to get a better understanding of big-picture trends.
One tool to help with predicting future transit use is to know where people have mobility needs today. Port Authority’s Equity Index of Mobility Need was designed to help in planning and prioritizing system and infrastructure improvements needed for populations which have been shown through research to have higher need for public transportation services.
Another tool that uses some of the same data inputs but weights them differently and adds in a few more key factors is called a Transit Propensity Model. This measures the likelihood that people in a given area would use transit if it were provided—whether or not it exists there today.

What neighborhoods have high mobility need & transit propensity?
Click on the map to enlarge it. Additional neighborhood data and what it means is below—feel free to scroll through the list!
Mobility need and transit propensity look at demographics in ways that allow us to gauge current and future demand for transit, respectively. The next step is to see where these factors are the highest and where they overlap.
Some neighborhoods have all the factors that indicate transit use should be high, but the actual ridership doesn’t match. This tells us there is something that needs improvement. Poor sidewalks, unsafe crossings and insufficient shelter, and steep topography may make existing bus stops undesirable. Perhaps the service isn’t frequent enough to suit work schedules, or isn’t stopping along the right corridor to serve the workers who most need it. Understanding on a neighborhood-by-neighborhood level who uses transit, who needs transit, and where they need to go guides NEXTransit to understand the connections that are needed and plan them appropriately.


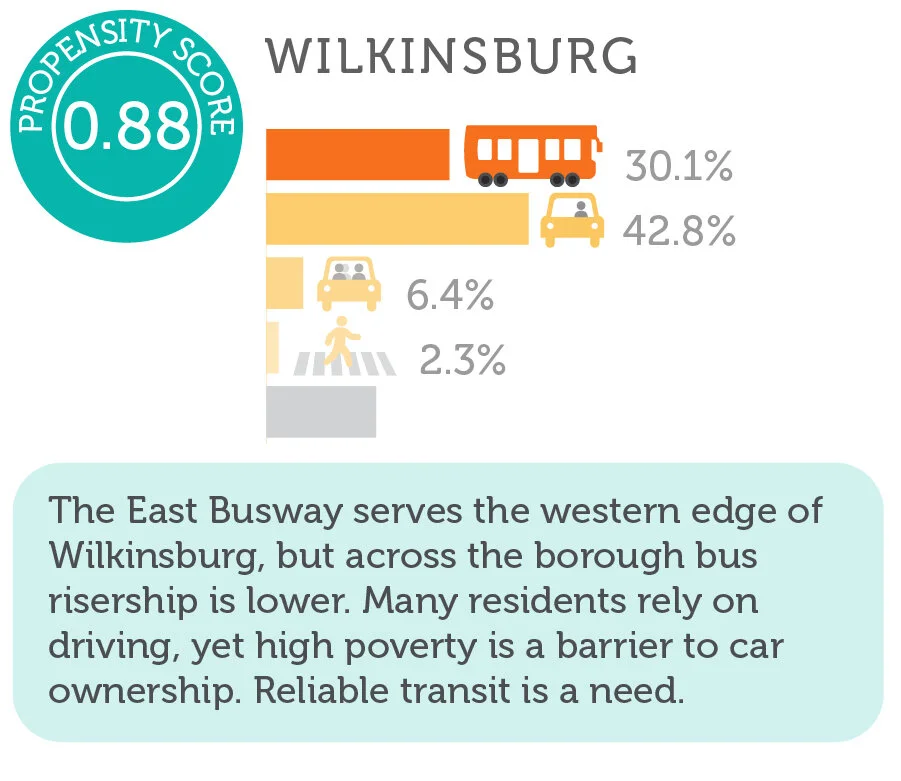
Transit propensity scores rate every census tract in the County out of a maximum of 1.00 and reveal where there may be demand for greater transit investment.
You made it to the end! Your patience will be rewarded by exploring the transit connection areas interactive map!